


Your 2025 Guide to Becoming a Successful Data Engineer: Skills, Tools, and Career Path
Learn how to become a successful data engineer in 2025 with the right skills, tools, and roadmap. Explore emerging trends, cloud platforms, and how data engineers drive modern data analytics and visualization services for business growth.
Data is no longer “just” a byproduct of business — it’s the fuel that runs modern companies. In 2025, organizations are racing to build reliable, fast, and governed data platforms so they can power AI, deliver analytics, and ship new data products. That makes data engineering one of the most strategic and in-demand careers today. This guide walks you through what employers want, the tools you must know, a realistic learning path, how to make your experience stand out, and how to tie your work into business-facing outcomes like data analytics and visualization services.
Why Data Engineering in 2025?
Two simple realities explain why this career is hot:
-
Companies are centralizing and productizing data to power analytics and AI — which requires robust pipelines, governance, and infra engineering. A 2025 snapshot of the field estimates the sector employs well over 150,000 professionals with strong year-over-year growth and thousands of new openings created annually.
-
Cloud-first strategies have reached critical mass: a large majority of enterprises now use cloud services for production workloads and data storage, creating demand for engineers who know cloud data stacks, streaming, and data warehousing. Recent industry summaries report enterprise cloud adoption rates well into the 90% range and a rapidly increasing share of workloads hosted in the cloud.
Put simply: if you build reliable, scalable data systems — and can connect them to analytics and visualization workflows — you’ll be solving problems businesses will pay to have solved.
What Employers Are Hiring For (skills & mindset)
Data engineering sits at the intersection of software engineering, systems thinking, and data domain knowledge. Employers consistently look for people who can:
-
Design and operate data pipelines (batch + streaming). That means orchestration, retries, idempotency, monitoring, and cost-aware design.
-
Work with cloud data platforms (AWS/GCP/Azure) and managed services like Snowflake, Databricks, BigQuery, Redshift. Cloud experience is effectively table stakes.
-
Own data quality & observability — testing, schema contracts, lineage, and monitoring with tools like Great Expectations, Monte Carlo-type tools or open-source equivalents.
-
Model data for analytics and ML — data modeling (dimensional, normalized), transformations (dbt-style), and building datasets that are easy to consume by analysts and data scientists.
-
Think product-first — deliver commensurate SLAs, documentation, onboarding, and consumers-first APIs or datasets so that analytics or ML teams can move fast.
Beyond technical chops, hiring managers want engineers who can communicate with analysts, product managers, and stakeholders — translating business needs into reliable data services that power dashboards, reporting, and ML models.
Core Technologies & Tools to Learn (practical list)
Tool choices evolve, but in 2025 a few categories and names dominate hiring posts:
-
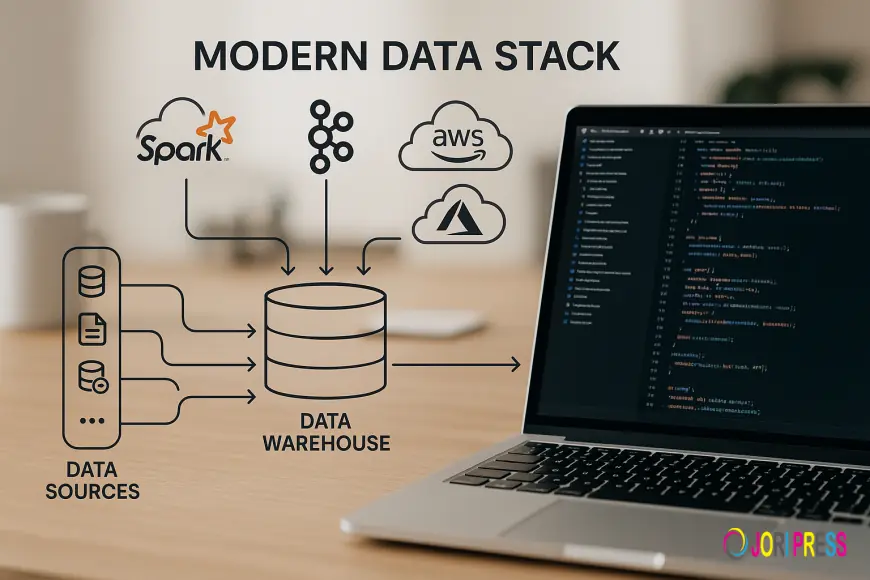
Cloud & Storage: AWS (S3, Glue, Redshift), GCP (BigQuery), Azure Synapse. Cloud data platforms underpin most modern pipelines.
-
Data Warehouses & Lakehouses: Snowflake, Databricks, BigQuery — these are primary targets for transformed analytical data.
-
Processing Engines: Apache Spark (batch/ML) and serverless Spark variants; stream processors like Apache Kafka (and Kafka-as-a-service offerings) for real-time streams.
-
Orchestration & Transformation: Airflow, Dagster, and dbt for transformations and pipeline orchestration. dbt especially for the analytics engineering layer.
-
Observability & Testing: Great Expectations (data tests), Prometheus/Grafana (metrics), and data observability platforms for alerting and lineage.
-
APIs & Access: Knowledge of REST/GraphQL for data services; experience securing datasets (IAM, encryption, masking).
-
Visualization & Analytics Integration: You must understand how datasets surface in BI tools (Looker, Power BI, Tableau) and how to expose curated datasets for data analytics and visualization services.
Knowing how the pieces fit together — not just the syntax of one tool — is what separates a junior engineer from a product-minded data engineer.
A Practical Learning Roadmap (0 → 18 months)
Below is a condensed, actionable trajectory you can follow.
Months 0–3: Fundamentals
-
Learn Python (focus on data libraries: pandas, SQLAlchemy).
-
Master SQL (window functions, CTEs, performance tuning).
-
Understand basic Linux, git, and APIs.
Months 3–6: Batch & Warehousing
-
Build ETL jobs that load into a data warehouse (Snowflake/BigQuery).
-
Learn basic data modeling (star/snowflake schema).
-
Start with cloud free tiers and move datasets from raw to curated.
Months 6–12: Streaming, Orchestration & Testing
-
Implement a simple Kafka or pub/sub stream.
-
Use Airflow or Dagster to schedule ETL and orchestrate dependencies.
-
Add data tests (Great Expectations) and basic metrics/alerting.
Months 12–18: Production Hardening & Product Skills
-
Optimize cost and performance in cloud (partitioning, caching, cluster sizing).
-
Build data contracts and lineage docs; practice stakeholder-facing documentation.
-
Build a portfolio: 2–3 end-to-end projects that show raw → cleaned → modeled → dashboard flow (include a demo of data analytics and visualization services consuming your datasets).
This roadmap is deliberately practical: employers want demonstrable, end-to-end projects.
How to Make Your Portfolio & Resume Stand Out
Hiring teams see lots of “I can use Spark” claims. Show them outcomes:
-
End-to-end project: In your portfolio, include a short case study: source dataset, architecture (diagram), processing choices, schema, cost and latency numbers, and one dashboard built from your datasets. If you’ve enabled a business use (e.g., customer churn dashboard, sales funnel analytics), explain the business impact.
-
Numbers matter: “Reduced ETL runtime from 3 hours to 30 minutes” or “cut cloud storage costs by 40% via partitioning and compaction” — concrete metrics convey competence.
-
Open-source contributions & blog posts: Short writeups about debugging data skew, optimizing joins, or implementing data contracts score points.
-
Expose your datasets: Host a public demo (with synthetic data) and show how your outputs plug into BI tools that deliver data analytics and visualization services.
Where the Money Is (salary & demand — realistic picture)
Salary ranges vary by region, company, and experience. In 2025, average U.S. data engineer base figures reported by multiple industry guides sit around the low-to-mid six figures (roughly $100k+), with senior engineers and those in major tech hubs commanding substantially higher compensation, plus equity and bonuses. Use regional salary benchmarks and job postings to set expectations for your market.
Aligning with Business: From Pipelines to Products
The highest-impact data engineers don’t just ship pipelines — they deliver data products that users can rely on. That means:
-
SLA & SLT definitions: Ensure data freshness, accuracy, and availability meet consumer needs.
-
Documentation & onboarding: Make it trivial for analysts or product teams to discover and use datasets.
-
Delivering analytics-ready datasets: Structure outputs to minimize downstream transformation — this directly powers better, faster data analytics and visualization services.
-
Feedback loops: Create channels for analytics teams to report data quality issues and prioritize fixes.
When you can trace your work to improved decision-making or revenue impact, you become a strategic hire.
Interview Prep: What to Practice
-
SQL debugging & optimization problems (explain plan, indexes, partitioning).
-
System design for data (design a streaming ingestion pipeline for clickstream data).
-
Coding assignments in Python/Scala — write clear, testable code.
-
Behavioral stories about production incidents, trade-offs you made, and metrics you improved.
Practice on real datasets and frame answers with numbers and clear technical reasoning.
Special Focus: Integrating with Data Analytics & Visualization Services
If your goal is to enable analytics teams or to work at consultancies offering data analytics and visualization services, you should:
-
Build datasets that are pre-aggregated for common queries and parameterized for flexibility.
-
Provide semantic layers (LookML, Cube models) so dashboards are consistent and governed.
-
Instrument datasets with metadata (last refresh, row counts, lineage) so analysts can trust sources.
-
Learn one major BI tool (Power BI, Tableau, Looker) enough to debug and advise on dashboard performance.
Many organizations buy analytics as a service; engineers who can both build the pipeline and understand dashboarding patterns are especially valuable to such teams.
The Career Ladder & Specializations
Data engineering can branch into many tracks:
-
Platform/Infrastructure engineers: Focus on cost, scale, and infra (data platform teams).
-
Analytics engineers: Own transformation layers and the semantic model (dbt, BI integration).
-
Streaming engineers: Specialize in real-time systems and event-driven architecture.
-
ML infra engineers: Support feature stores, model pipelines, and MLOps.
Choose a direction after gaining broad exposure; specialization increases impact and pay over time.
Final Checklist: First 90 Days as a New Data Engineer
-
Map the data consumers and their SLAs.
-
Identify the riskiest pipeline (failures, cost overruns) and propose a small win.
-
Add basic observability (metrics, alerts) where it’s missing.
-
Deliver one documented dataset for analytics that directly supports a business metric.
-
Start a log of optimization experiments and share a short weekly update.
Closing — Your Next Step
The world runs on data, and in 2025 that means you have an accelerating set of opportunities if you can build reliable data foundations and connect them to business outcomes. Start small, build end-to-end projects that show measurable impact, master the cloud/data toolchain, and learn to communicate with analytics consumers — especially those delivering data analytics and visualization services.If you want more insight regarding Data engineering kindly visit Impressico Blogs.
What's Your Reaction?
 Like
0
Like
0
 Dislike
0
Dislike
0
 Love
0
Love
0
 Funny
0
Funny
0
 Angry
0
Angry
0
 Sad
0
Sad
0
 Wow
0
Wow
0