







































Building a Reliable Algorithmic Trading Strategy: From Market Research to Risk Management

Algorithmic trading has changed how market participants analyze opportunities and execute trades in the stock market. Instead of manually monitoring price movements and placing every order, traders can use computer programs to follow predefined instructions. These instructions may be based on technical indicators, price levels, trading volume, or statistical calculations.
However, successful automated trading involves much more than writing a few lines of code. A strategy must be supported by proper market research, realistic testing, execution planning, and risk management. Even a technically advanced trading system can perform poorly if its underlying assumptions are incorrect.
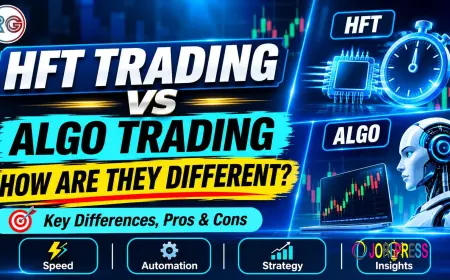
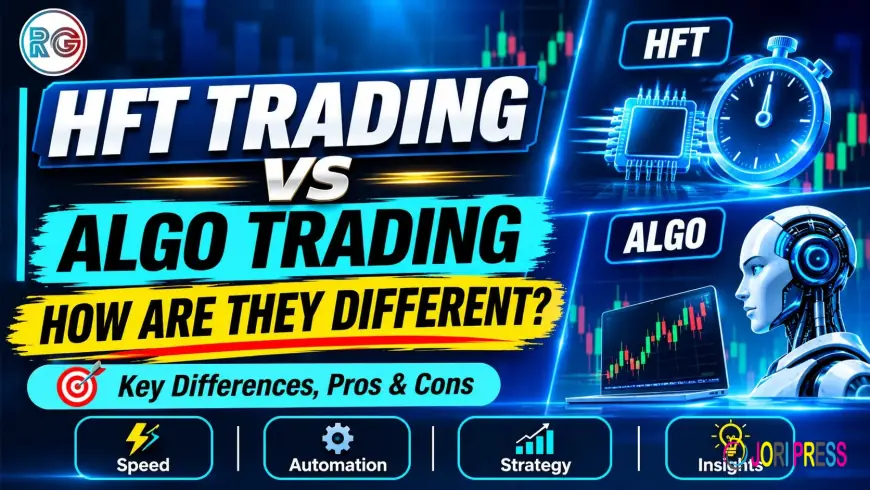
For beginners interested in automated trading, understanding the relationship between strategy development and execution technology is an important starting point. Learning about different approaches, including the concepts covered in HFT vs. Algo training, can help traders understand how automated systems operate and why speed alone does not determine trading performance.
Understanding the Foundation of Algorithmic Trading
Algorithmic trading involves using computer programs to generate or execute orders according to predefined rules. These rules determine when to enter a trade, when to exit, and how much capital to allocate.
A basic algorithmic strategy generally consists of four elements:
-
Market Conditions: Identifying the type of market in which the strategy is expected to operate.
-
Trading Signals: Establishing specific conditions that generate buy or sell signals.
-
Execution Rules: Defining how and when orders should be placed.
-
Risk Management: Setting limits on position size, potential losses, and overall exposure.
Consider a simple moving average crossover strategy. A trader may use a 20-day moving average and a 50-day moving average to identify potential market trends.
When the shorter moving average crosses above the longer moving average, the system generates a potential buy signal. When it crosses below, the system generates a potential sell signal.
The computer follows these instructions without requiring the trader to monitor every price movement manually. However, the strategy still requires testing because moving average crossovers can generate false signals, particularly in sideways markets.
Why Strategy Development Matters More Than Complex Technology
One common misconception among beginners is that advanced software automatically produces better trading results. In reality, technology only helps execute the instructions provided by a strategy.
A simple strategy with clearly defined rules may be more useful than a complicated system based on numerous indicators without a logical foundation.
Before developing an automated trading system, traders should consider the following factors:
1. Identifying a Market Opportunity
Every trading strategy should have a clear purpose. Some strategies attempt to capture long-term price trends, while others look for short-term reversals or temporary pricing differences.
For example, a trend-following strategy attempts to participate in sustained upward or downward price movements. A mean-reversion strategy assumes that prices may move back towards their historical average after an unusually large deviation.
Understanding the market behavior behind a strategy helps traders avoid creating rules based purely on random historical patterns.
2. Selecting Relevant Indicators
Technical indicators help convert market information into measurable trading conditions.
Commonly used indicators include:
-
Moving Averages: Used to identify market trends.
-
Relative Strength Index (RSI): Helps assess the strength of recent price movements.
-
Moving Average Convergence Divergence (MACD): Used to identify potential changes in momentum.
-
Average True Range (ATR): Measures market volatility and can assist with stop-loss calculations.
-
Volume Indicators: Help examine trading activity and market participation.
Using too many indicators can make a strategy unnecessarily complicated. It is generally more useful to select indicators that serve a specific purpose.
The Importance of Backtesting Before Live Trading
Backtesting is the process of evaluating a trading strategy using historical market data. It allows traders to understand how predefined rules would have performed under previous market conditions.
For example, suppose a trader develops a strategy for a Nifty 50 constituent stock. The system generates a buy signal when the 20-day moving average crosses above the 50-day moving average.
Instead of immediately investing real money, the trader can test these rules against historical price data.
Some important performance measurements include:
|
Metric |
What It Measures |
|
Win Rate |
Percentage of trades that generate profits |
|
Net Profit |
Profit remaining after applicable trading costs |
|
Maximum Drawdown |
Largest decline from a previous portfolio peak |
|
Profit Factor |
Gross profits divided by gross losses |
|
Average Trade Return |
Average financial result per completed trade |
One important consideration is that historical performance does not guarantee future results.
A strategy may perform exceptionally well on historical data because its parameters have been excessively adjusted to past market movements. This problem is known as overfitting.
To reduce this risk, traders should evaluate their strategies using separate testing periods and avoid relying exclusively on the data used during development.
Understanding Execution Costs and Slippage
A trading strategy may appear profitable during backtesting but produce different results in a live market.
One major reason is the difference between expected execution prices and actual execution prices.
This difference is known as slippage.
For example, assume an algorithm generates a buy signal when a stock reaches ₹500. However, due to market movement and available liquidity, the order gets executed at ₹502.
The trader has paid ₹2 more per share than expected.
For 100 shares:
Slippage Cost = (Actual Execution Price − Expected Execution Price) × Quantity
Slippage Cost = (₹502 − ₹500) × 100
Slippage Cost = ₹200
Apart from slippage, traders must account for brokerage, securities transaction tax, exchange transaction charges, GST, stamp duty, and other applicable costs.
These expenses can significantly affect strategies that generate frequent transactions.
Therefore, realistic cost assumptions should always be included when evaluating an automated trading system.
Risk Management in Automated Trading Systems
Automation can improve execution consistency, but it cannot eliminate market risk.
A computer program will continue following its instructions unless appropriate conditions or controls are established. If those instructions are incorrect or market conditions change unexpectedly, the system may generate unwanted orders.
A reliable automated trading framework should include the following safeguards:
Position Sizing: Determine the quantity of shares or contracts based on available capital and acceptable risk.
Stop-Loss Rules: Define conditions under which a position should be closed to limit potential losses.
Maximum Daily Loss: Establish a threshold beyond which the system stops generating new trades.
Order Limits: Set restrictions on order quantities and trading activity.
Monitoring: Regularly review open positions, executed orders, system performance, and unexpected behavior.
Emergency Controls: Maintain a mechanism to stop automated trading when technical problems or unusual market conditions arise.
These controls are especially important when strategies operate without continuous manual supervision.
The Role of Technology in Modern Trading
Programming languages and data analysis tools play an important role in developing automated trading strategies.
Python is widely used for financial data analysis, strategy research, and backtesting because of its extensive libraries.
Some useful tools include:
-
Pandas: Helps organize and analyze historical market data.
-
NumPy: Supports numerical calculations and mathematical operations.
-
Matplotlib: Creates charts to visualize market trends and strategy performance.
-
Backtesting Libraries: Help evaluate trading rules against historical datasets.
-
Broker APIs: Allow supported applications to communicate with trading platforms and submit orders.
For beginners, learning basic Python, financial mathematics, and statistical concepts can provide a useful foundation.
However, programming knowledge should be combined with an understanding of market structure, order types, liquidity, and trading regulations.
Algorithmic Trading Regulations in India
Automated trading in India operates within a regulatory framework established by the Securities and Exchange Board of India (SEBI) and implemented through recognised stock exchanges and brokers.
On 4 February 2025, SEBI issued a circular titled Safer Participation of Retail Investors in Algorithmic Trading. The framework addresses the responsibilities of investors, stockbrokers, algorithm providers, and market infrastructure institutions.
It also establishes requirements intended to strengthen risk management and provide safeguards for retail participation in algorithmic trading.
Retail traders planning to use broker APIs or third-party algorithmic strategies should understand the applicable requirements before deploying their systems.
Regulatory procedures and operational requirements may be updated. Therefore, traders should consult the latest SEBI circulars, relevant NSE or BSE guidelines, and their broker's instructions.
Conclusion
Developing an effective algorithmic trading system requires a combination of market knowledge, strategy research, programming, realistic testing, and disciplined risk management. Advanced technology can improve execution, but it cannot compensate for weak trading logic or poor financial decisions.
Beginners should focus on understanding market behavior, testing simple strategies, calculating actual trading costs, and establishing appropriate risk controls before considering live automated execution.
Disclaimer: This article is intended for educational purposes only and should not be considered investment advice or a recommendation to buy or sell any financial instrument. Trading involves financial risk, and past performance does not guarantee future results.
What's Your Reaction?
 Like
0
 Dislike
0
 Love
0
 Funny
0
 Angry
0
 Sad
0
 Wow
0