


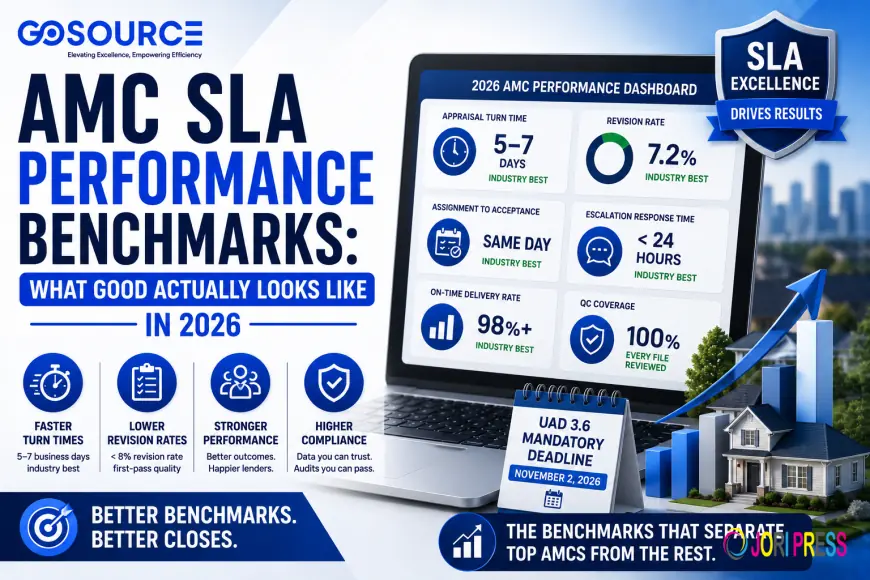
AMC SLA Performance Benchmarks: What Good Actually Looks Like in 2026
When lenders evaluate appraisal management companies, the conversation almost always starts with service level agreements. But here is the problem: most SLA conversations stay at the surface, turn times, delivery confirmations, and a promised response window without ever getting to the numbers that separate a high-performing AMC from one that is quietly dragging down your pipeline.
When lenders evaluate appraisal management companies, the conversation almost always starts with service level agreements. But here is the problem: most SLA conversations stay at the surface, turn times, delivery confirmations, and a promised response window without ever getting to the numbers that separate a high-performing AMC from one that is quietly dragging down your pipeline.
In 2026, with UAD 3.6 mandatory adoption approaching on November 2, lender margins under sustained pressure, and GSE scrutiny of appraisal quality at an all-time high, “we meet our SLAs” is not enough. The question is whether your AMC’s SLA commitments are benchmarked against what the industry’s best performers deliver and whether the data verify that performance is visible to you in real time.
This post lays out the specific benchmarks that define genuine AMC SLA performance in 2026, across every dimension that matters.
Why SLA Benchmarks Matter More Than SLA Promises
There is a meaningful difference between an AMC that promises SLA performance and one that can demonstrate it with data.
A promise is a commitment to a vendor’s contract. A benchmark is a measurable standard with documented outcomes that can be compared against industry norms, verified during an audit, and tracked over time. Lenders who evaluate AMC partners purely on SLA promises without access to historical performance data and real-time pipeline visibility are operating on trust rather than evidence.
The strongest lender-AMC partnerships in 2026 are no longer measured by volume alone. They are measured by closing rate impact, revision frequency, and time-to-final-report metrics. Lenders are demanding dashboards, weekly performance reviews, and SLA-backed turn times, and the best AMCs are delivering them as standard, not as add-ons.
Understanding what those benchmarks actually are is the starting point for every serious lender’s evaluation.
Benchmark 1: Appraisal Turn Time
Turn time, measured from order acceptance to report delivery, is the most visible SLA metric and the one most directly tied to closing timelines and borrower experience.
Top-tier benchmark: Five to seven business days for standard residential assignments in urban and suburban markets.
Industry average: Eight to fourteen business days, with rural and complex assignments frequently running longer.
What drives the gap: The difference between top and average performers is rarely about appraiser availability alone. Assignment speed, for how quickly an order moves from placement to acceptance, is a primary driver. AMCs with automated assignment routing move orders in seconds; those using manual coordinator processes can lose hours or days before an appraiser even accepts. Panel depth at the ZIP code level, not just total roster size, is the other critical variable. A panel with 25,000 appraisers and thin active coverage in the subject market delivers slower than a smaller panel with deep, verified local availability.
What to ask your AMC: Ask for turn time data segmented by geography and property type, not a single average. A seven-day average that includes urban markets but conceals fifteen-day rural performance is misleading.
Benchmark 2: Revision Rate
Revision rate measures the percentage of delivered appraisal reports that require correction, additional support, or resubmission before they are acceptable for loan delivery. It is the single, clearest indicator of first-pass quality.
Top-tier benchmark: Below 8% revision rate across the portfolio.
Underperforming benchmark: 15% to 25% or higher, a range that directly inflates closing-cycle time and increases operational cost for both the AMC and the lender.
Why it matters beyond cost: Every revision is a delay. In a purchase transaction with a rate of lock in place, a revision cycle that adds three to five days can trigger a lock extension, which has a real dollar cost to the borrower and a relationship cost to the loan officer. AMCs that hold revision rates under 8% are not just running cleaner operations; they are protecting lender relationships and borrower outcomes simultaneously.
What drives revision rates: Quality control coverage is the primary level. AMCs that review every file before delivery catch errors before they become revisions. Those relying on sampling miss the files that would have generated revision requests, and those requests show up later, at the worst point in the closing timeline.
Benchmark 3: Assignment-to-Acceptance Time
This is benchmarking fewer lenders’ track explicitly, but it is one of the most sensitive indicators of pipeline health. It measures the time from when an order is placed to when an appraiser formally accepts the assignment.
Top-tier benchmark: Same-day acceptance for standard orders in covered markets.
Signs of a problem: Acceptance delays of 24 to 72 hours or orders that cycle through multiple appraisers before finding acceptance indicate panel depth problems, assignment process inefficiency, or fee-competitiveness issues.
Why it matters: Assignment-to-acceptance time is where many pipeline delays originate. An order that sits unaccepted for two days before being manually reassigned has already lost nearly a full third of the expected total turn time before a single inspection has been scheduled. Tracking this metric separately from overall turn time gives lenders early visibility into where delays are originating.
Benchmark 4: Escalation Response Time
Not every appraisal order goes smoothly. Inspections get rescheduled, appraisers request extensions, rush orders arise, and access issues occur. How an AMC handles exceptions, and how fast is a direct measure of operational competency that standard SLA reporting often does not capture.
Top-tier benchmark: Same-day acknowledgment of escalations, with resolution or documented action plan within 24 hours.
What poor escalation performance looks like: Lender coordinators are unable to reach the AMC contact when a problem surfaces. Status updates require the lender to initiate the inquiry. Escalations that sit in a queue without acknowledgment. Resolution timelines communicated after the fact rather than proactively.
What to look for: AMCs that provide dedicated account management with a named contact who knows the lender’s workflow and can resolve issues quickly consistently outperform those routing all inquiries through a general support queue. This is not a premium feature; it is a baseline expectation from any AMC operating at a serious service level.
Benchmark 5: UCDP Submission Success Rate
As UAD 3.6 mandatory adoption arrives on November 2, 2026, a new performance metric becomes essential: the rate at which appraisal reports are accepted by the UCDP on first submission.
Top-tier benchmark: 98% or higher first-pass UCDP acceptance rate.
What failure looks like: Rejected submissions require correction and resubmission, adding pipeline days and creating documentation gaps in the loan file. AMCs that do not validate UAD 3.6 format and MISMO 3.6 schema compliance before submission generate rejection rates that compound across high-volume pipelines into significant operational drag.
Why this is now an SLA item: Before UAD 3.6, UCDP submission was largely a technical formality. Under the new structured data format, submission failure is a real operational risk one that belongs to every AMC service level agreement going forward. Lenders should be asking their AMC partner specifically what their UCDP first-pass acceptance rate has been during UAD 3.6 broad production testing, not waiting to find out after November 2.
Benchmark 6: Reconsideration of Value Turnaround
ROV turnaround is an increasingly important SLA dimension, elevated by regulatory attention to fair lending and the PAVE framework’s emphasis on transparent, accessible reconsideration processes.
Top-tier benchmark: ROV acknowledgment within 24 hours of receipt, with substantive response within five to seven business days.
Why it matters: ROV delays are not just a borrower’s experience problem; they are a compliance signal. Regulatory guidance around appraisal bias has made it clear that a reconsideration process that is slow, opaque, or inconsistently applied creates fair lending exposure for both the AMC and the lender. Tracking ROV turnaround time as a discrete SLA metric sends an internal and external signal that the process is taken seriously.
Benchmark 7: SLA Reporting Transparency
This one is less obvious but arguably as important as any individual performance metric. The best AMC partners do not just perform against benchmarks; they make their performance visible.
Top-tier standard: Real-time lender portal access with full pipeline visibility, weekly or monthly performance reporting by metric category, and on-demand data access for audit or internal reporting purposes.
What to look for: If your AMC cannot give you a real-time view of turn time by geography, revision rates by appraiser or loan type, and escalation resolution rates, ask why. In 2026, data transparency is infrastructure, not a premium service tier. AMCs that cannot produce this reporting are either not tracking it or not confident in what it would show.
Building SLA Expectations into Every AMC Relationship
The practical implication of these benchmarks is that SLA expectations need to be specific, documented, and tied to actual performance data not just acknowledged in a vendor’s contract.
When establishing or renewing an AMC relationship, lenders should request historical performance data across every benchmark above before signing. Verify that the AMC can produce file-level audit trails, real-time pipeline visibility, and UAD 3.6 submission documentation. And build review cadences into the relationship monthly or quarterly performance reviews where data is shared; gaps are discussed, and expectations are recalibrated if market conditions change.
An AMC that performs against documented, data-backed SLA benchmarks is not just a vendor; it is an operational partner that actively protects closing timelines, compliance posture, and borrower experience.
How Go Source Valuation Supports SLA-Driven AMC Performance
At Go Source Valuation, our back-office support infrastructure is built around the performance standards that serious lender partnerships demand. From workflow management that drives turn time consistency to quality control processes that reduce revision rates, our team operates as an extension of your AMC with the process discipline and compliance expertise that SLA accountability requires.
If you are ready to evaluate your AMC’s performance against what top-tier partners actually deliver, we would like to be part of that conversation. Visit our AMC Management Solutions page to learn more.
Frequently Asked Questions
What is an AMC SLA, and what should it cover?
An AMC service level agreement is a documented commitment to specific, measurable performance standards across the appraisal management workflow. A complete SLA should cover turn time by geography and property type, revision rates, assignment-to-acceptance time, escalation response windows, UCDP submission success rates, and ROV turnaround, not just a general delivery window.
What is a good appraisal turn-time benchmark for an AMC?
Top-tier AMCs deliver standard residential appraisals in five to seven business days in urban and suburban markets. The industry average runs eight to fourteen business days. Rural and complex assignments typically run longer even for top performers, which is why turn time benchmarks should always be segmented by market type rather than reported as a single average.
What revision rate should I expect from a high-performing AMC?
Top-performing AMCs hold revision rates below 8% across their portfolio. Rates of 15% to 25% or higher are characteristic of underperforming partners and directly inflate closing timelines. Revision rate is the clearest available proxy for first-pass appraisal quality and QC coverage.
What is assignment-to-acceptance time, and why does it matter?
Assignment-to-acceptance time measures the gap between when an order is placed and when an appraiser formally accepts it. Top-performing AMCs achieve same-day acceptance for standard orders in covered markets. Delays at this stage, which often go unreported in standard turn time metrics, are one of the most common hidden sources of pipeline slowdowns.
How does UAD 3.6 affect AMC SLA benchmarks?
UAD 3.6 adds UCDP first-pass acceptance rate as a new SLA dimension measuring whether reports are submitted in compliant MISMO 3.6 format and accepted by the UCDP without rejection. With the November 2, 2026, mandate in effect, UCDP submission success becomes a measurable, lender-facing performance standard that belongs in every updated AMC service level agreement.
What should I look for in AMC SLA reporting?
Real-time pipeline visibility through a lender-facing portal, performance data segmented by geography and loan type, regular reporting cadences, and on-demand data access for audit purposes. An AMC that cannot provide this level of reporting transparency is not operating at a standard that allows for genuine performance accountability.
How does ROV turnaround connect to fair lending compliance?
Slow or inconsistent ROV processes carry fair lending exposure because regulatory guidance, including PAVE task force recommendations, treats accessible, timely reconsideration processes as part of an AMC’s overall equity compliance posture. Including ROV turnaround as a discrete SLA metric document shows that the process is taken seriously and creates an auditable record of responsiveness.
What's Your Reaction?
 Like
0
Like
0
 Dislike
0
Dislike
0
 Love
0
Love
0
 Funny
0
Funny
0
 Angry
0
Angry
0
 Sad
0
Sad
0
 Wow
0
Wow
0